
Lead Capture and Explainable Scoring
See where every lead came from, how it scores and which signals moved the score, then route or assign it.
These images are illustrations of the concept, not screenshots of the actual product.
Overview
A lead score is only useful if people trust it. Many scoring systems produce a number with no explanation, so sales teams ignore it and marketers cannot tell which campaigns actually create intent. This concept shows how the Leads tab of the HeadshotMarketing CRM is designed to capture leads from every source and make their scores explainable.
The first illustration presents a leads list with a New Lead button, summary cards for total leads, average lead score, conversion rate and hot leads, and a small score distribution chart. The table records each lead's name, company, source (web, ads, event or referral, each with its own icon), a color-coded score, a status from new and working to qualified or unqualified, estimated value, owner and created date, so a team can see volume and quality in one place.
The second illustration refines the same view. Summary cards show total leads, average score and a count of high-intent leads scoring 80 or more, next to a distribution chart bucketed from 0-20 up to 81-100. Each row pairs the score with an inline bar and names the source, such as a webinar, paid social, organic, a referral, a content download or an event, along with the owner and when the lead was last updated. Selecting a lead opens a side panel with the person's name, company and role, the score and how much it has changed recently, and a Why this score breakdown listing the signals that contributed points: campaign engagement, a demo request, content views, profile completeness and email recency. A plain-language sentence summarizes the behavior behind the number, and a notice inside the panel marks this breakdown as a preview state, in which scores are entered by the team rather than calculated for them.
From the panel, Route to nurture and Assign owner turn the explanation into action, handing the lead to an automation workflow or to a salesperson. The concept connects campaigns, content and events to the pipeline through a score that shows its work.
What this concept shows
- Summary cards for total leads, average score, conversion rate, hot leads and high-intent leads
- Score distribution chart showing how leads spread across score ranges
- Leads table with source icons, color-coded scores, status, estimated value and owner
- Lead statuses including new, working, contacted, qualified, unqualified and disqualified
- Side panel with the selected lead's score and its recent change
- Why this score breakdown listing the points each signal contributed
- Plain-language summary of the behavior behind a score
- Route to nurture and Assign owner actions on the selected lead
How it works
- Open the Leads tab in the CRM to see lead volume, average score and the score distribution.
- Add a lead with New Lead, or review leads arriving from web, ads, events, webinars and referrals.
- Scan the table by source, score, status and owner to find leads worth attention.
- Select a lead to open the side panel with its score and recent change.
- Read the Why this score breakdown and summary to understand which signals drove the number.
- Choose Route to nurture to hand the lead to an automation workflow, or Assign owner to pass it to sales.
Who it's for
- Sales development representatives
- Demand generation managers
- Marketing and revenue operations teams
- Sales managers qualifying inbound pipeline
Illustrations
2 illustrations of this concept. Select one to view it full size.
Leads List with Sources and Scores
This illustration shows the CRM Leads page with tabs for Contacts, Leads, Deals and Pipeline, Leads selected, and a New Lead button beside the Leads heading. A small score distribution bar chart sits in the top right corner. Four summary cards report total leads, average lead score, conversion rate and hot leads. The table beneath lists each lead with an avatar and name, company, a source with its own icon for web, ads, event or referral, a color-coded lead score badge, a status badge such as new, working, qualified or unqualified, estimated value, owner, created date and a row menu. The application window is framed on a light backdrop. The design gives a team a quick read on lead volume and quality together. All leads and figures are sample data.
Why This Score: Lead Score Breakdown
This illustration shows the Leads tab alongside Overview, Contacts and Pipeline tabs. Summary cards report total leads, average score and high-intent leads scoring 80 or more, next to a score distribution chart bucketed from 0-20 up to 81-100. The table lists lead, company, source, a status badge, a score with an inline bar, owner or unassigned, and a relative updated time. One row is highlighted, opening a side panel for a sample head of demand generation. The panel shows a large score with a chip noting how much it has risen since an earlier date, then a Why this score list of signals with points and bars: campaign engagement, demo request, content views, profile completeness and email recency. A short sentence describes the activity behind the score, a notice marks the breakdown as a preview state in which scores are entered by the team, and Route to nurture and Assign owner buttons sit at the foot of the panel.
Topics
- lead scoring
- explainable lead scoring
- why this lead score
- lead source tracking
- inbound lead management
- high intent leads
- lead qualification
- lead score distribution
- route leads to nurture
- assign lead owner
Related concepts
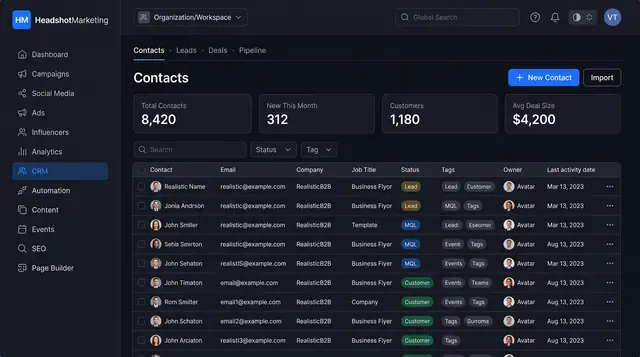
Contacts and Sales Pipeline
Keep every contact in one searchable table and follow deals across a visual pipeline from first lead to closed won.
2 illustrations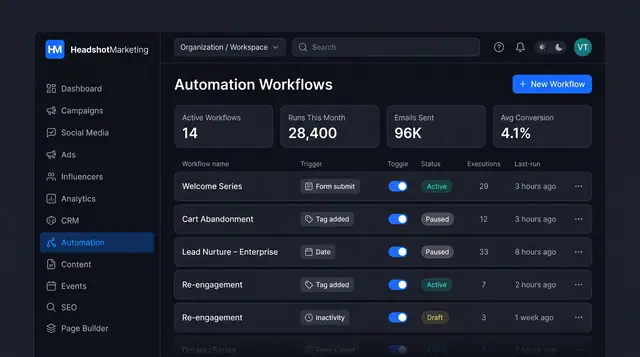
Lead Nurture Workflow Automation
Build trigger-based nurture journeys that email, text, wait and branch on behavior, and manage every workflow from one list.
2 illustrations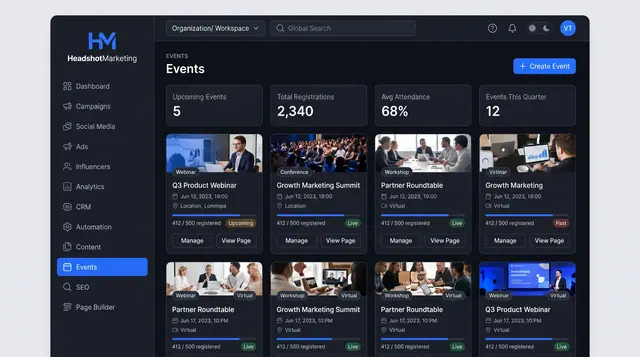
Event Marketing
Plan webinars, conferences and workshops, track registrations against capacity, and publish an event page from one form.
2 illustrations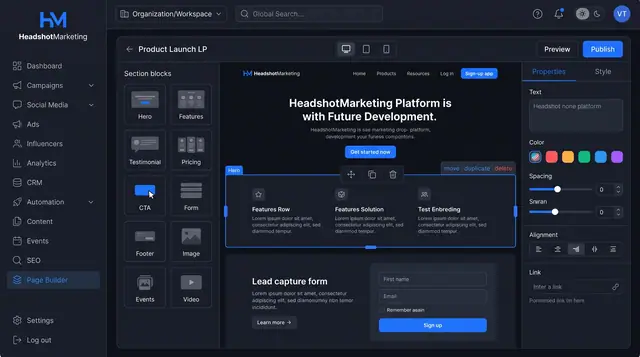
Drag-and-Drop Landing Page Builder
Assemble landing pages from ready-made blocks, edit each section's properties, preview by device and publish without code.
1 illustration