
Contacts and Sales Pipeline
Keep every contact in one searchable table and follow deals across a visual pipeline from first lead to closed won.
These images are illustrations of the concept, not screenshots of the actual product.
Overview
Marketing and sales often run on separate systems, so the person who clicked a campaign email and the deal a salesperson is chasing live in different records. This concept puts both into the CRM module of HeadshotMarketing, where a contact record and the deals that grow from it share one workspace with the campaigns, automation and analytics that touch them.
The contacts illustration opens with a sub-navigation for Contacts, Leads, Deals and Pipeline, and summary cards for total contacts, new contacts this month, customers and average deal size. A search field and Status and Tag filters sit above a selectable table listing each contact's name, email, company, job title, lifecycle status, tags, owner and last activity date. Status badges distinguish leads, marketing-qualified leads and customers, and tags carry context such as events attended. New Contact and Import buttons cover manual entry and bulk loading.
The pipeline illustration turns deals into a board. Columns for Lead In, Qualified, Proposal, Negotiation and Closed Won each show the total value and number of deals in that stage. Deal cards carry an account name, a value, a win probability with a progress bar, the owner's avatar and a due date, so a sales manager can see where value is concentrated and which deals are due soon. A New Deal button adds opportunities directly to the board.
Together, the screens are designed to give marketing and sales one shared picture of the funnel. The lifecycle statuses marketing tracks on the contacts table sit one tab away from the deals sales works on the board, and both live in the same workspace as the campaigns, automations and reports elsewhere in the product, so pipeline value can be read alongside the activity that produced it.
What this concept shows
- Contacts, Leads, Deals and Pipeline sub-navigation within the CRM
- Summary cards for total contacts, new this month, customers and average deal size
- Searchable contacts table with Status and Tag filters and row selection
- Lifecycle status badges for lead, marketing-qualified lead and customer
- New Contact and Import actions for manual and bulk entry
- Kanban pipeline with stage totals and deal counts from Lead In to Closed Won
- Deal cards with value, win probability bar, owner and due date
How it works
- Open the CRM on the Contacts tab to see headline counts and the full contact table.
- Search, or filter by status and tag, to find the contacts that matter now.
- Add a contact with New Contact, or bring a list in with Import.
- Switch to Pipeline to see deals grouped by stage, with value and count for each column.
- Add an opportunity with New Deal and track its value, probability, owner and due date.
- Follow each deal as it progresses through Qualified, Proposal and Negotiation toward Closed Won.
Who it's for
- Sales representatives and account executives
- Sales managers forecasting pipeline
- Marketing operations teams managing lifecycle stages
- Small business owners running marketing and sales together
- Revenue operations leads
Illustrations
2 illustrations of this concept. Select one to view it full size.
Contacts Table with Status and Tags
This illustration shows the Contacts tab of the CRM, with CRM highlighted in the left navigation and a sub-navigation for Contacts, Leads, Deals and Pipeline. New Contact and Import buttons sit beside the page title. Four summary cards report total contacts, new contacts this month, customers and average deal size. A search box and Status and Tag dropdowns filter the table below, which has a select-all checkbox and columns for contact name with avatar, email, company, job title, status, tags, owner and last activity date, plus a menu on each row. Status badges separate leads, marketing-qualified leads and customers, and tag chips add context such as events. The table continues below the fold. Names, addresses and counts are placeholder sample data.
Kanban Sales Pipeline
This illustration shows the Pipeline tab of the CRM, titled Sales Pipeline, with a New Deal button at the top right. Five columns run across the page: Lead In, Qualified, Proposal, Negotiation and Closed Won. Each column header shows the stage's total deal value and the number of deals it holds, and the columns are subtly tinted to tell stages apart. Deal cards show an account initial, a deal name for a sample enterprise account, the deal value, a win probability percentage with a progress bar, the owner's avatar and a due date. Columns hold different numbers of cards, which makes it easy to see where deals are piling up. The design is meant to let a sales team read the whole funnel on one screen. Values and names are sample data.
Topics
- marketing CRM
- contact management
- sales pipeline kanban
- deal tracking
- lifecycle stage tracking
- MQL to customer
- import contacts
- deal win probability
- sales pipeline management
Related concepts
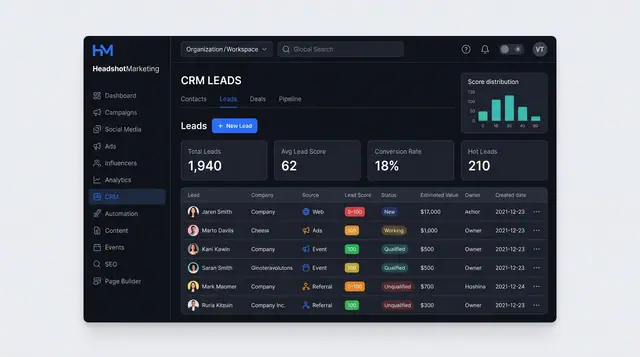
Lead Capture and Explainable Scoring
See where every lead came from, how it scores and which signals moved the score, then route or assign it.
2 illustrations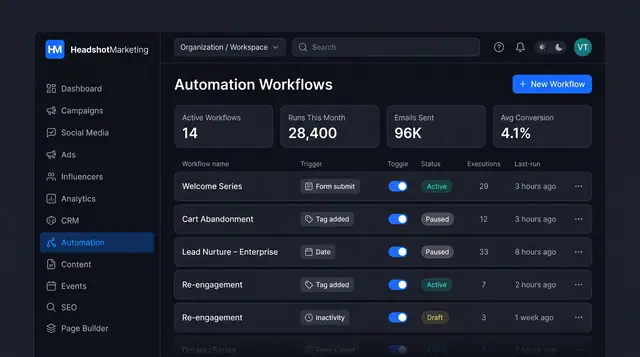
Lead Nurture Workflow Automation
Build trigger-based nurture journeys that email, text, wait and branch on behavior, and manage every workflow from one list.
2 illustrations
Attribution Analytics and Reports
Compare revenue and ROAS by channel, weigh first- against last-touch credit, then turn the view into a report you can schedule and share.
2 illustrations
All-in-One Marketing Command Center
One front door and one home dashboard for revenue, ROAS, funnel stages and channel performance across all your marketing.
2 illustrations