
All-in-One Marketing Command Center
One front door and one home dashboard for revenue, ROAS, funnel stages and channel performance across all your marketing.
These images are illustrations of the concept, not screenshots of the actual product.
Overview
The command center is the starting point of HeadshotMarketing: a single place where a marketing team arrives, sees how the business is performing, and moves on to whichever module needs attention. This concept illustrates two moments of that experience: the public landing page that introduces the platform to a new visitor, and the home dashboard a signed-in marketer sees first.
Most teams piece together their picture of performance from separate tools: an email platform, a social scheduler, an ad manager for each network, a CRM and a spreadsheet to reconcile them. Revenue, spend and funnel numbers rarely line up, and nobody can see every channel side by side. The design answers this with one workspace-level view that draws on the same campaigns, contacts and channels the rest of the product manages.
The landing page leads with the promise of one platform for campaigns, social, ads, CRM and analytics. It offers Get Started Free and Book a Demo actions, previews the dashboard inside a browser frame, and follows with tiles for Campaigns, Automation and Analytics. Once inside, the dashboard opens with four KPI cards, Total Revenue, ROAS, Conversions and Active Campaigns, each with a trend badge and a sparkline. Below them, a Revenue & Spend by Channel area chart plots eight weeks of data, a Conversion Funnel steps from Visitors through Leads and MQL to Customers, a Recent Campaigns table lists name, channel, status, spend and ROAS, and a Channel Performance donut splits results across email, social, paid and events.
The persistent chrome frames everything else in the product. A left sidebar lists the product's modules: Dashboard, Campaigns, Social Media, Ads, Influencers, Analytics, CRM, Automation, Content, Events, SEO and Page Builder. The top bar carries an organization and workspace switcher, global search, help, notifications, theme controls and the user menu. Every figure on the dashboard is sample data; the concept is about which signals sit together on the first screen a marketer sees each day.
What this concept shows
- A public landing page with Get Started Free and Book a Demo calls to action and a dashboard preview in a browser frame
- Landing-page feature tiles introducing Campaigns, Automation and Analytics
- Four KPI cards for Total Revenue, ROAS, Conversions and Active Campaigns, each with a trend badge and sparkline
- A Revenue & Spend by Channel area chart across eight weeks with a series selector
- A Conversion Funnel stepping from Visitors to Leads, MQL and Customers
- A Recent Campaigns table with channel, status, spend and ROAS columns
- A Channel Performance donut comparing email, social, paid and events
- A persistent sidebar of module links from Campaigns and Social Media through CRM, Automation, SEO and Page Builder, with a workspace switcher and global search in the top bar
How it works
- Arrive on the landing page to see what the platform covers and preview the dashboard.
- Choose Get Started Free, Book a Demo or Sign In from the landing page.
- Land on the Dashboard and scan the KPI cards for revenue, ROAS, conversions and active campaigns.
- Compare revenue and spend week by week and read the funnel from visitors to customers.
- Review recent campaigns and the channel mix, then open the relevant module from the sidebar.
Who it's for
- Marketing leaders and CMOs
- Growth and demand-generation managers
- Small-business owners running their own marketing
- Agency account leads managing client workspaces
Illustrations
2 illustrations of this concept. Select one to view it full size.
Landing Page with Dashboard Preview
This illustration shows the logged-out landing page the design envisions as the front door to HeadshotMarketing. A top navigation bar carries the logo, Product, Solutions, Pricing and Resources menus, and Sign In and Get Started buttons. The centered hero states the idea in one headline, the all-in-one marketing platform, with a supporting line naming campaigns, social, ads, CRM and analytics, followed by Get Started Free and Book a Demo buttons. Below sits a browser-framed preview of the dashboard with KPI cards, a line chart, a bar chart and a table, set against a soft glow. A muted row of logo placeholders marks where partner or integration marks would sit, and three feature tiles introduce Campaigns, Automation and Analytics with short placeholder copy. The page demonstrates how the product is framed before sign-in: one platform and one entry point for the whole marketing motion.
Home Dashboard
This illustration shows the Dashboard, the first screen a signed-in marketer sees. The left sidebar lists every module with Dashboard highlighted, and the top bar holds an organization and workspace switcher, global search, help, notifications, theme controls and the user avatar. Four KPI cards run across the top: Total Revenue, ROAS, Conversions and Active Campaigns, each with a sample value, an up or down percentage badge and a small sparkline. A Revenue & Spend by Channel area chart overlays two series across eight weeks, with a legend dropdown to change what is plotted. Beside it, a Conversion Funnel narrows from Visitors to Leads, MQL and Customers. Along the bottom, a Recent Campaigns table lists name, channel, status, spend and ROAS, and a Channel Performance donut compares email, social, paid and events. All figures are sample data, and the screen demonstrates how the concept puts the headline numbers of every channel on one page.
Topics
- marketing command center
- all-in-one marketing platform
- marketing dashboard
- ROAS dashboard
- revenue and spend by channel
- conversion funnel dashboard
- marketing KPI dashboard
- unified marketing and sales platform
- channel performance analytics
Related concepts
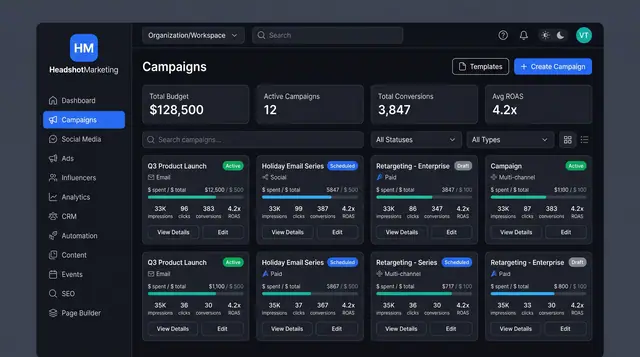
Multi-Channel Campaign Launch
Browse campaigns, start from a template, brief one launch across email, social, paid and events, then track spend and ROAS.
4 illustrations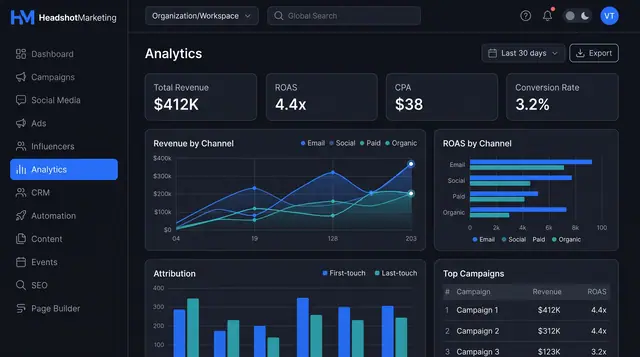
Attribution Analytics and Reports
Compare revenue and ROAS by channel, weigh first- against last-touch credit, then turn the view into a report you can schedule and share.
2 illustrations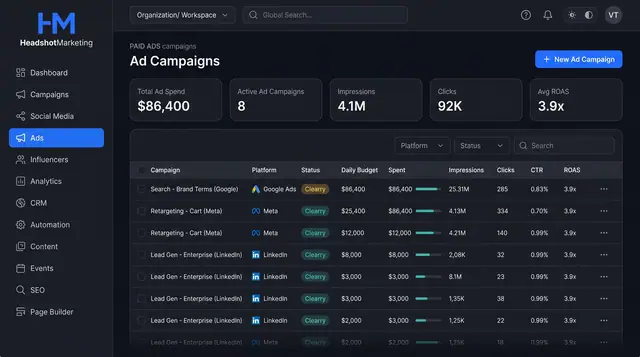
Paid Ad Campaigns and Audiences
Run Google, Meta, LinkedIn and TikTok campaigns from one table, set them up in a guided wizard and reuse saved audiences.
3 illustrations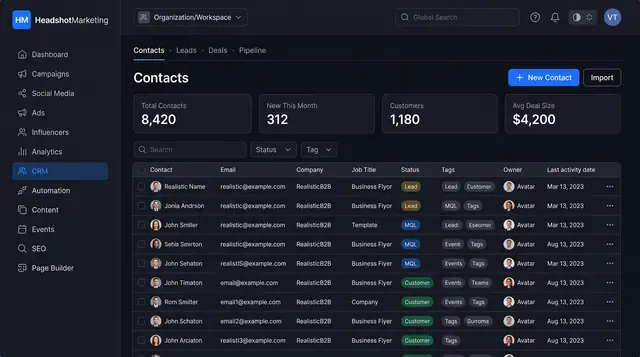
Contacts and Sales Pipeline
Keep every contact in one searchable table and follow deals across a visual pipeline from first lead to closed won.
2 illustrations