
Paid Ad Campaigns and Audiences
Run Google, Meta, LinkedIn and TikTok campaigns from one table, set them up in a guided wizard and reuse saved audiences.
These images are illustrations of the concept, not screenshots of the actual product.
Overview
Paid advertising is often the largest line in a marketing budget and the hardest to see as a whole. This concept illustrates how HeadshotMarketing is designed to bring paid campaigns from several ad networks into one module: a table of every ad campaign, a guided wizard for creating a new one, and a library of reusable audience segments.
Advertisers commonly switch between Google Ads, Meta, LinkedIn and TikTok, each with its own interface, reporting and audience definitions. Comparing spend and ROAS across them means exporting and reconciling data, and the same target audience gets rebuilt on every network. The design keeps spend, performance and targeting in one place, alongside the campaigns and contacts the rest of the product manages.
The Ad Campaigns page opens with summary cards for total ad spend, active ad campaigns, impressions, clicks and average ROAS. A table below lists each campaign with its platform, status, daily budget, amount spent with a progress bar, impressions, clicks, CTR and ROAS. It can be filtered by platform and status or searched, with checkboxes for bulk selection and a menu on each row. The Create Ad Campaign wizard moves through Platform, Objective, Budget, Audience and Review steps. On the budget step illustrated, the user picks a platform, an objective, daily and total budgets, a bid strategy, dates and a saved audience, while a Reach estimate card shows an estimated daily range on a gauge. The Audiences page presents saved segments as cards with their size, an active toggle, criteria chips such as age range, job title, interests and location, and how many campaigns use them; selecting one opens a side panel with a demographics chart and the full criteria list.
Paid campaigns can be one channel of a wider multi-channel campaign, and their results feed the home dashboard and analytics. Creative testing and spend optimization build on the same ad campaigns. All campaign names, budgets and results in the illustrations are sample data.
What this concept shows
- Summary cards for total ad spend, active ad campaigns, impressions, clicks and average ROAS
- A campaign table with platform, status, daily budget, spend progress, impressions, clicks, CTR and ROAS columns
- Platform and status filters, search, bulk-select checkboxes and per-row action menus
- A five-step setup wizard: Platform, Objective, Budget, Audience and Review
- Platform choices for Google Ads, Meta, LinkedIn and TikTok with objective and bid strategy dropdowns
- A Reach estimate card with an estimated daily range and gauge
- Reusable audience cards with size, an active toggle, criteria chips and campaign usage
- An audience side panel with a demographics chart and the full criteria list
How it works
- Open Ads to review spend and results across every ad campaign, filtering by platform or status.
- Choose New Ad Campaign to start the setup wizard.
- Pick the ad platform and the campaign objective.
- Set daily and total budgets, a bid strategy and dates, and check the reach estimate.
- Select a saved audience, or define one on the Audiences page from age, job title, interest and location criteria.
- Review the setup, then save a draft or launch the campaign.
Who it's for
- Performance marketers and paid media specialists
- Demand-generation managers
- Marketing leaders responsible for ad budgets
- Agencies managing paid media for several clients
Illustrations
3 illustrations of this concept. Select one to view it full size.
Ad Campaigns Table
This illustration shows the Ad Campaigns page in the Ads module, with a New Ad Campaign button in the header. Five summary cards report total ad spend, active ad campaigns, impressions, clicks and average ROAS. The main card holds Platform and Status dropdowns and a search field above a table. Each row has a selection checkbox, a campaign name such as a sample brand-terms search campaign, a cart retargeting campaign or an enterprise lead-generation campaign, the platform with its logo (Google Ads, Meta or LinkedIn), a status badge, the daily budget, the amount spent with a small progress bar, impressions, clicks, CTR, ROAS and a row menu. The last row fades out to suggest the list continues. All figures are sample data. The screen demonstrates how the concept lets a team compare paid performance across networks without switching tools.
Create Ad Campaign Wizard
This illustration shows the Create Ad Campaign page, reached through an Ads / New Ad Campaign breadcrumb. A horizontal stepper lists Platform, Objective, Budget, Audience and Review, with the first two complete and Budget current. The form card offers platform chips for Google Ads, Meta, LinkedIn and TikTok, with Google Ads selected, and an Objective dropdown set to Conversions. Daily Budget and Total Budget fields hold sample amounts, a Bid Strategy dropdown reads Maximize conversions, and a start and end date pair sits beside it. An Audience dropdown selects a saved enterprise decision-makers segment. On the right, a Reach estimate card shows an estimated daily range with a gauge. A footer holds Back, Save Draft and Launch Campaign. The screen demonstrates how the design breaks paid setup into clear steps and gives feedback on reach before launch.
Reusable Ad Audiences
This illustration shows the Audiences page in the Ads module, with a New Audience button in the header. Saved segments appear as a grid of cards with sample names such as enterprise decision makers, cart abandoners and newsletter subscribers. Each card shows an audience size, an Active/Inactive toggle, criteria chips for an age range, job title, interests and a location, and a note of how many campaigns use the audience. The toggles show a mix of active and inactive segments. One card is highlighted as selected, and a side panel titled Audiences opens on the right with a close button, a Demographics donut chart and a Criteria section listing the segment's rules as chips. All sizes and counts are sample data. The screen demonstrates how the concept lets advertisers define targeting once and reuse it across campaigns and networks.
Topics
- paid ads management
- cross-platform ad campaign manager
- Google Ads, Meta, LinkedIn and TikTok campaigns
- ad campaign ROAS tracking
- ad budget and bid strategy
- audience segmentation for ads
- saved ad audiences
- ad campaign setup wizard
- ad reach estimate
- CTR and ROAS reporting
Related concepts
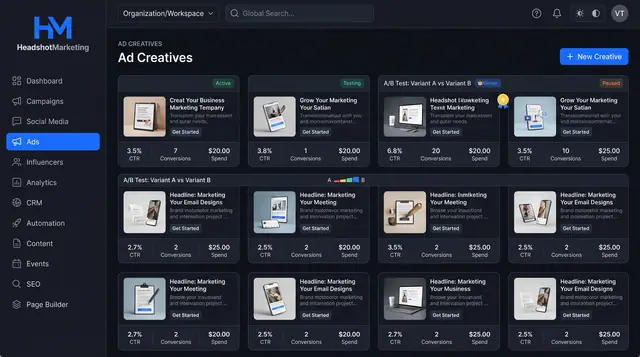
Ad Creative Testing and Spend Optimization
Compare ad creatives side by side, spot A/B test winners and approve evidence-backed budget and audience changes.
2 illustrations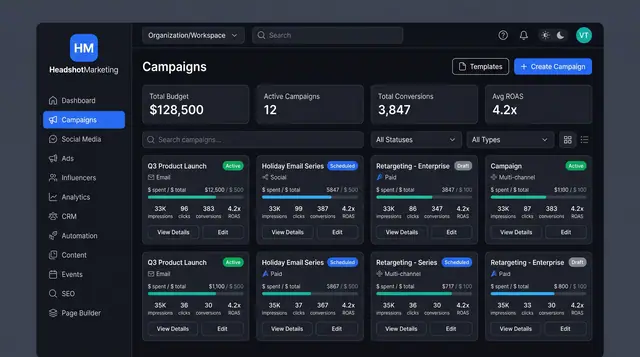
Multi-Channel Campaign Launch
Browse campaigns, start from a template, brief one launch across email, social, paid and events, then track spend and ROAS.
4 illustrations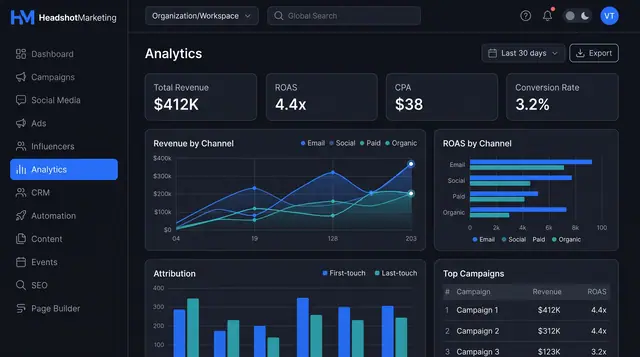
Attribution Analytics and Reports
Compare revenue and ROAS by channel, weigh first- against last-touch credit, then turn the view into a report you can schedule and share.
2 illustrations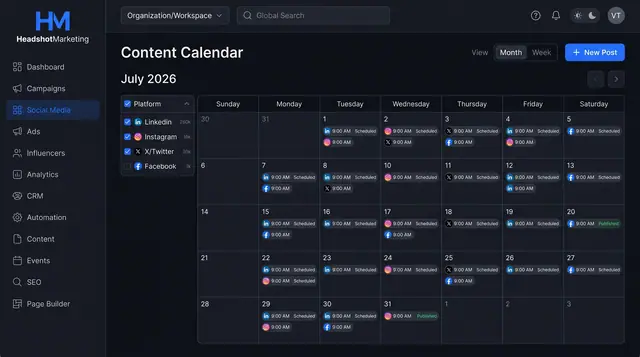
Social Scheduling and Publishing
Plan posts on a shared calendar, compose once for several networks with a phone preview, and keep every connected account healthy.
3 illustrations