
Ad Creative Testing and Spend Optimization
Compare ad creatives side by side, spot A/B test winners and approve evidence-backed budget and audience changes.
These images are illustrations of the concept, not screenshots of the actual product.
Overview
Launching a paid campaign is only the start. Once ads are running, the real work is figuring out which creative earns its spend, which budget is capped in the wrong place and which audience has run out of room. In many teams that analysis happens in spreadsheets exported from each ad network, days after the money is gone. This concept brings creative testing and spend optimization into the Ads module of HeadshotMarketing, next to the campaigns and audiences they act on.
The first illustration shows an Ad Creatives gallery. Each creative is a card with a device preview of the ad, its headline and short body copy, a call-to-action chip and a footer of three numbers: click-through rate, conversions and spend. Status badges mark creatives as active, testing or paused, and variants under test are grouped into A/B test blocks, where the stronger variant carries a winner badge so the result is legible at a glance. A New Creative button starts the next variant.
The second illustration moves to an Optimization tab that sits alongside Ad campaigns, Creatives and Audiences. An overnight analysis run summarizes a week-long period, shows its completion state and records what the run cost, then presents a short set of proposals: shift daily budget from one search campaign to another, pause an underperforming creative, or widen an audience that is delivery-limited. Every proposal states an expected outcome and lists the evidence behind it, such as a cost per acquisition compared with its four-week average or a click-through rate against the account average. Nothing changes until someone selects Approve, and Dismiss sets a proposal aside.
Beneath the proposals, a channel performance table for the last seven days reports spend, impressions, clicks, conversions, revenue and ROAS for paid search, paid social and display, giving the context needed to judge each recommendation. Together, the two screens are designed to close the loop between creative experiments, budget decisions and the revenue reporting found elsewhere in the product.
What this concept shows
- Creative gallery cards with a device preview, headline, body copy and call-to-action chip
- Click-through rate, conversions and spend in a consistent footer on every creative
- Active, testing and paused status badges on each creative
- Grouped A/B test blocks that flag the winning variant with a badge
- Overnight analysis run with its period, completion status and run cost
- Budget-shift, pause-creative and widen-audience proposals with an expected impact
- Evidence rows under every proposal, with Approve and Dismiss actions
- Seven-day channel performance table with spend, revenue and ROAS
How it works
- Open Ads and go to the creatives view to see every ad variant as a card.
- Compare click-through rate, conversions and spend across active, testing and paused creatives.
- Read the A/B test blocks to see which variant carries the winner badge, and start another variant with New Creative.
- Switch to the Optimization tab to review the latest overnight analysis run.
- Check each proposal's expected outcome and evidence, then Approve or Dismiss it.
- Use the channel performance table to see how spend, revenue and ROAS compare across channels.
Who it's for
- Performance marketers and paid media managers
- Growth leads responsible for acquisition budgets
- Creative teams iterating on ad variants
- Agency account managers optimizing client spend
- Marketing directors who sign off on budget changes
Illustrations
2 illustrations of this concept. Select one to view it full size.
Ad Creatives Gallery with A/B Test Results
This illustration shows the Ad Creatives page of the Ads module, with Ads highlighted in the left navigation and a workspace switcher, global search, help, notifications, theme and profile controls across the top. A New Creative button sits opposite the page title. The main area is a grid of creative cards, each pairing a preview of the ad on a tablet, phone or laptop with a headline, two lines of body copy and a Get Started call-to-action chip. Every card ends in the same three metrics: CTR, conversions and spend. In the top row, badges mark creatives as active, testing or paused, and a block labeled as a Variant A versus Variant B test holds two cards, one wearing a winner badge and ribbon. A second A/B test block spans a full row, with a small comparison bar between A and B in its header. All figures are sample data.
Optimization Proposals and Channel Performance
This illustration shows the Optimization tab of the Ads module, beside tabs for ad campaigns, creatives and audiences. A status line reports an overnight analysis that completed early in the morning for a week-long period, with a Completed badge, a View run details button and, on the right, the run's token count, duration and cost. Three proposal cards follow. One recommends moving daily budget from a brand search campaign to an automation search campaign for more conversions at the same spend, one recommends pausing a low-yield static creative, and one recommends widening a delivery-limited audience. Each card states an expected result, lists evidence such as cost per acquisition against a four-week average, click-through rate against the account average, ad frequency or estimated reach, and offers Approve and Dismiss buttons. Below, a last-seven-days table lists spend, impressions, clicks, conversions, revenue and ROAS for paid search, paid social and display, in sample rupee figures.
Topics
- ad creative A/B testing
- ad creative performance
- winning ad variant
- ad spend optimization
- budget reallocation recommendations
- ROAS by channel
- pause underperforming ads
- audience expansion recommendations
- paid media optimization
- cost per acquisition analysis
Related concepts
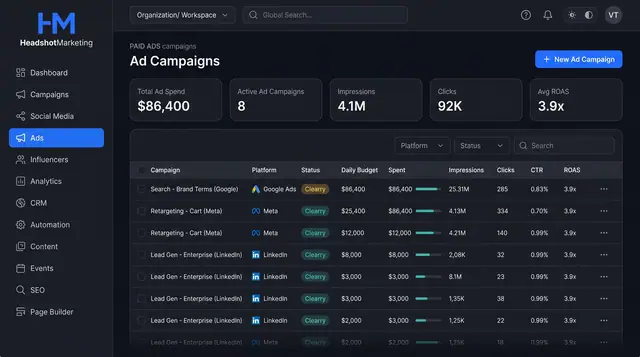
Paid Ad Campaigns and Audiences
Run Google, Meta, LinkedIn and TikTok campaigns from one table, set them up in a guided wizard and reuse saved audiences.
3 illustrations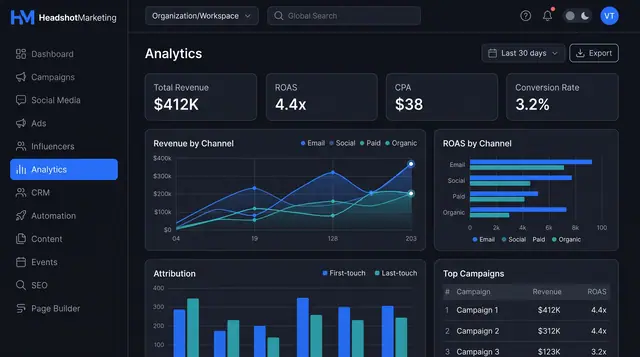
Attribution Analytics and Reports
Compare revenue and ROAS by channel, weigh first- against last-touch credit, then turn the view into a report you can schedule and share.
2 illustrations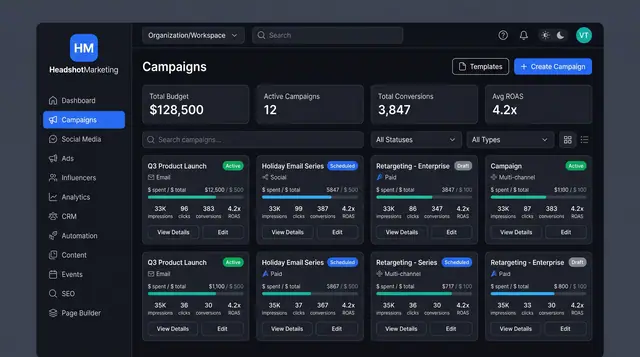
Multi-Channel Campaign Launch
Browse campaigns, start from a template, brief one launch across email, social, paid and events, then track spend and ROAS.
4 illustrations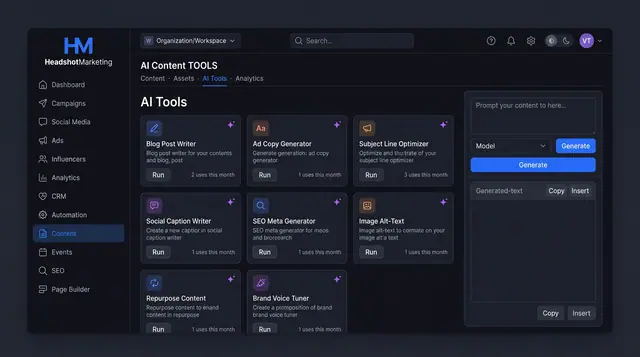
AI Content Tools and Usage Ledger
Run purpose-built AI writers for blogs, ads, emails and SEO, then see every run's tokens, cost and status in one ledger.
3 illustrations